
To test a real-time AI avatar on low-end devices, use browser throttling for early diagnosis and physical phones or laptops for release approval. Run a fixed conversation while measuring startup, frame pacing, input delay, memory, temperature, battery mode, interruption, and recovery. Keep the normal product path usable when the avatar cannot sustain its target quality.
Key takeaways
- Define the minimum supported device from audience data, not the oldest device in the office.
- Calibrate CPU throttling, then repeat the test on physical hardware.
- Test after the device warms up and while battery saving is active.
- Use a reduced-quality or non-avatar path when the client cannot maintain a useful interaction.
1. Define the minimum device and task
Write the device boundary in concrete terms: OS version, browser or app version, memory class, GPU family if known, and the exact avatar workflow. “Works on mobile” is not a test condition. A 30-second greeting and a 15-minute support session stress different resources.
Use product analytics and customer requirements to choose the long-tail device. Do not infer hardware capability from viewport size. The same CSS width can belong to a new flagship phone or an older device already under thermal pressure.
2. Build a small physical device matrix
Include one low-tier target phone, one older laptop without a discrete GPU, and one mid-tier control device. Add conditions rather than buying dozens of models: low battery, battery saver, a warm device, another active app, background/foreground transitions, and a weak network.
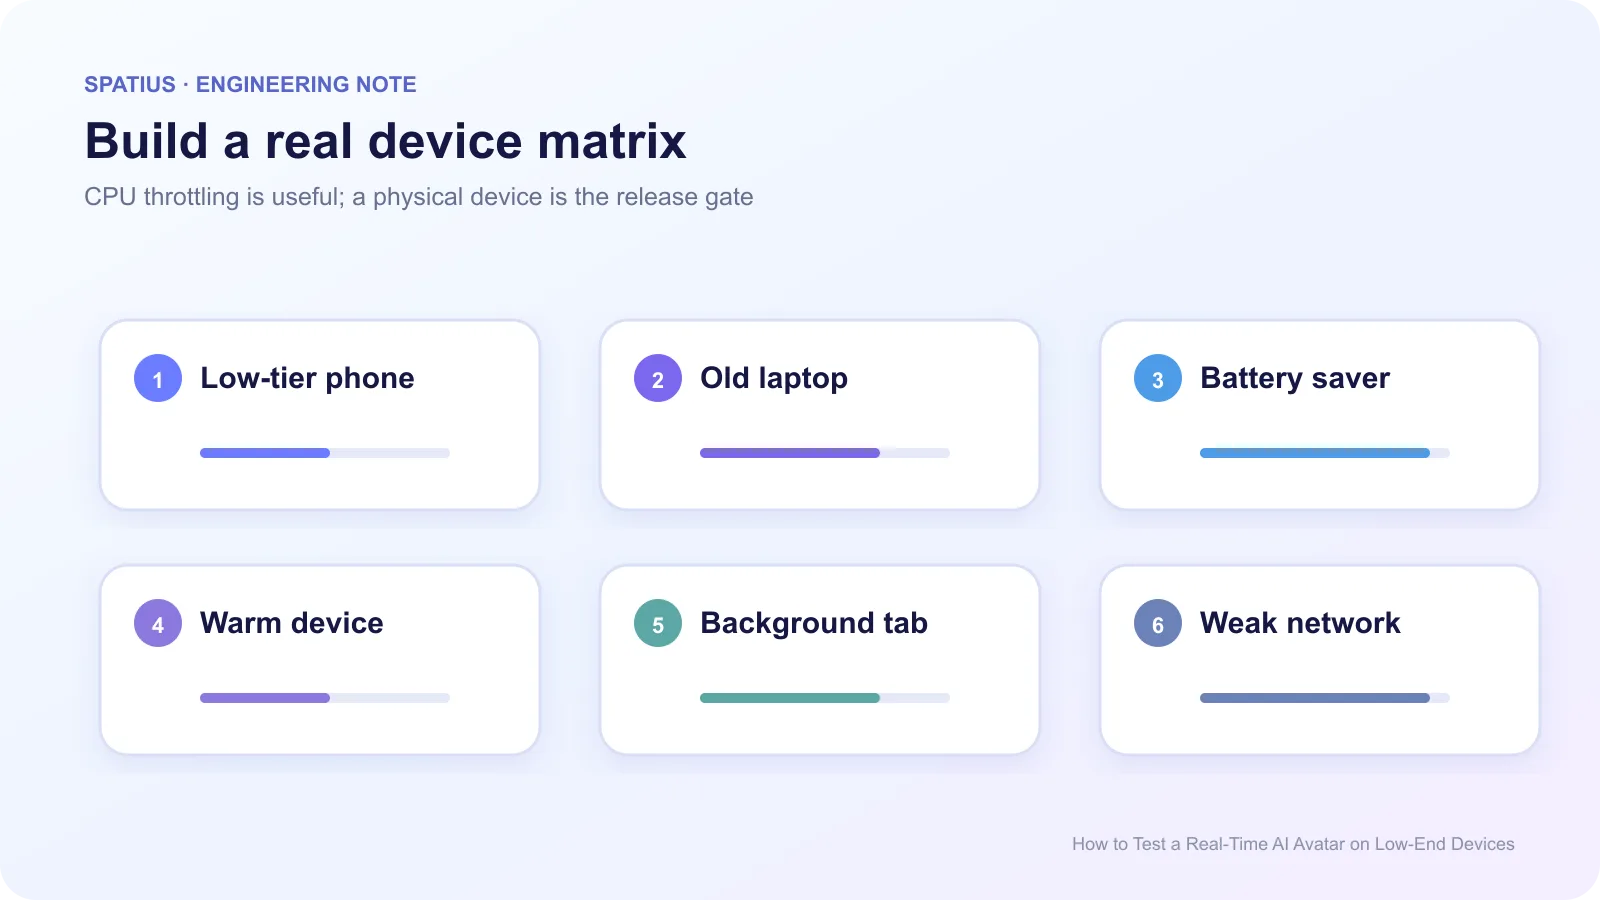
Chrome Device Mode is a useful first pass. Its low-end mobile preset applies slow-network and CPU throttling, but Chrome states that Device Mode is an approximation, not a physical device. Disk speed, memory bandwidth, thermals, and GPU behavior still differ.
3. Calibrate the development-machine simulation
Chrome 134 added CPU throttling calibration for low-tier and mid-tier presets tied to the development machine. Use it to reproduce problems quickly, then remote-debug the same flow on the target device.
Keep network and CPU experiments separate before combining them. A slow first motion can come from resource transfer, JavaScript work, shader preparation, or server response. If you throttle everything at once, the trace becomes harder to interpret.
For Android web testing, Chrome documents remote debugging on a physical device. Safari’s Web Inspector provides the corresponding route for WebKit-based testing.
4. Measure interaction health, not one FPS number
Record asset-ready time, first motion, frame duration distribution, long tasks, input delay, memory trend, dropped or late motion, audio continuity, and recovery. Chrome’s heap snapshot workflow can help compare retained memory before and after a fixed session. A stable 24 FPS can feel better than an average 45 FPS that freezes every few seconds.
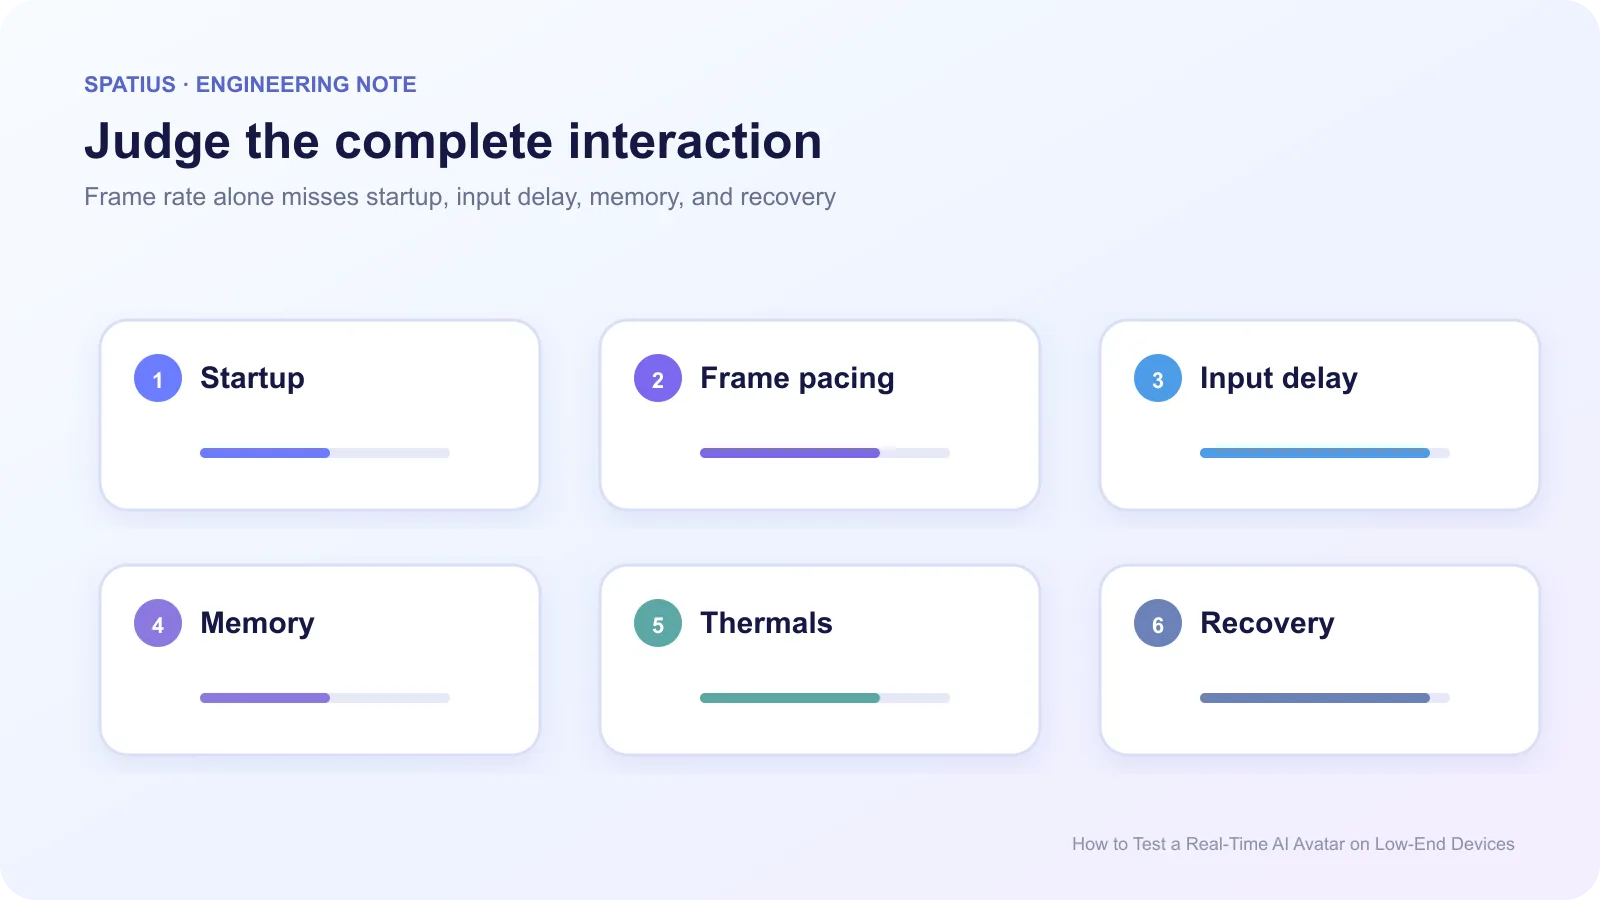
Use the DevTools Performance panel to find long tasks, style/layout work, and rendering stalls. The Long Tasks API can add production diagnostics, but treat browser support and privacy limits as part of the design.
Interaction to Next Paint, explained in the web.dev INP guide, is a page-level metric rather than an avatar score. It is still useful because an avatar should not make buttons, text input, mute, or exit controls unresponsive.
5. Test heat, battery mode, and backgrounding
Run the fixed conversation once on a cool device and again after sustained use. Thermal throttling can appear only after several minutes; Android’s thermal API guidance explains the severity states available to native clients. Chrome’s Energy Saver can limit background activity and visual effects; Google documents the behavior in its Chrome performance settings.
Send the app to the background during speech, then return. The Page Visibility API tells a web client when the document becomes hidden, but your application must decide whether to pause, finish audio, or recover on return.
Also test graphics recovery. The WebGL webglcontextlost event can occur under resource pressure. A blank canvas should become a controlled fallback, not a dead interaction.
6. Define quality tiers and a stop condition
Decide which optional effects, background detail, texture quality, or frame target can be reduced. The web.dev animation performance guide explains why transform and opacity are usually safer than layout-changing animation. Keep audio, user controls, and task state stable. If the device still cannot maintain the agreed experience, offer audio or text rather than running an overloaded renderer indefinitely.
Testing Spatius across clients
Spatius Direct Mode currently supports Web, iOS, Android, and Flutter, with platform-specific rendering stacks listed in the Direct Mode overview. Do not assume a WebGL result predicts Metal, Vulkan, or a Flutter wrapper.
The application still owns the agent, TTS, controls, and fallback. AvatarKit renders locally while Motion Server returns motion data. Use the docs map to find the current client reference before creating a platform test plan.
Pair physical-device results with the asset-loading guide and the bandwidth measurement guide to separate compute and network bottlenecks.
Frequently asked questions
Is Chrome CPU throttling enough for release approval?
No. It is useful for repeatable diagnosis. Physical hardware is still needed for GPU, memory, thermal, battery, disk, and platform-runtime behavior.
What should happen when a device is too slow?
Reduce optional visual work first. If the interaction remains unstable, preserve audio or text, task state, and visible controls instead of forcing animation.